Market-neutral or pair trade or statistical arbitrage is a investment strategy of matching a long position with a short position in two stocks of the same sector or with relatively similar beta. This creates a hedge against the sector and the overall market that the two stocks are in. The hedge created is essentially a bet that you are placing on the two stocks; the stock you are long in versus the stock you are short in. This divergence between pairs may be caused by temporary supply/demand changes, when a single large investor changes position in a single security. The pairs trade helps to hedge sector- and market-risk. If the market or sector crashes, you should experience a gain on the short position and a negating loss on the long position with the assumption that of a net profit.
Hedge investing is a market neutral investment strategy which is much more secured and consistent than a long-only investment strategy in stocks or equity mutual funds. In case of traditional stock investing, returns are whimsical, uncertain and unpredictable. No one has forgotten the recent financial crisis of 2008 or Ketan Parekh or Harshad Mehta episode of 1992. Many lost their shirts. Investment evaporated over 70%.
Contrary to traditional investments, hedge investing methodology is more secured, consistent, slow but persistently rewarding. A presentation on Hedge Investing can be downloaded from this website. Most of the time an investor’s biggest worry is a falling market as he just cannot safeguard his investment in a falling market. Our market neutral investment strategy is made to safeguard you from these shocks. It has consistently given positive return in a rising market as well as in a falling market.
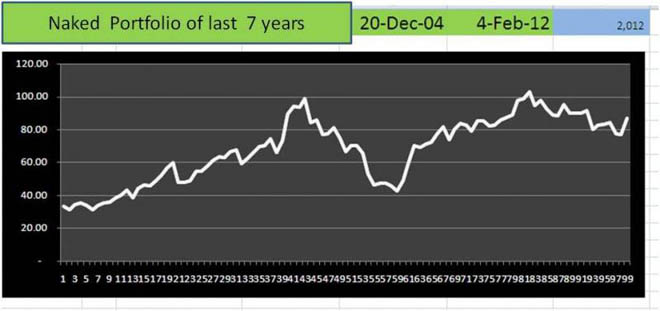
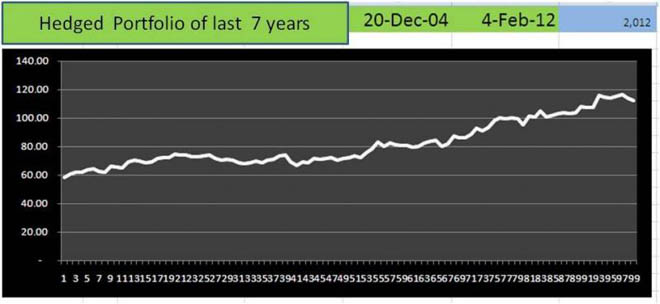
Our market neutral investment strategy is designed for those investors who need to safeguard their capital but at the same time want regular return which is much higher than bank fixed deposits. It is also designed for those who wish to make additional return on their existing investment portfolio without investing any new money. To make you understand how this strategy takes out volatility from stock market, we present two price scenario of a portfolio of 20 bluechip stocks for last 7 years.
Twenty Blue-chip companies:
ACC ITC COLPAL HDFC HDFCBANK SBIN AXISBANK BHEL LT HEROMOTOCO AMBUJACEM ASIANPAINT BHARTIARTL DRREDDY INFY TCS LUPIN RELIANCE TATASTEEL M&M
The strategy revolves around the convergence theory. When the correlation between the two share prices momentarily caves in, i.e. one stock moves up while the other moves down, the pair trade would be to long (buy) the underperformer and shorten (sell) the outperformer, assuming that the spread or the temporary gap between the two would eventually converge. Of course, apples and oranges do not make a good pair; there has to be some sort of compatibility between the two stocks, for instance, common industry or low beta with index, etc. The deviation between the paired securities can be caused due to various market forces like temporary demand / supply drive, the whim and fancy of a few operators, large trade orders, inside trading, news based euphoria, and so on.
To master this strategy one needs to understand the fundamental long-term correlation of the paired stocks, market timing, the drift in pair and, of course, stop-loss time. The strategy demands strong discipline in making and closing a pair. It is advisable not to mix up pairs among each other or leave a pair naked i.e., partly squared off either long or short position. Although there is not much downside risk in the paired strategy, one might not get enough number of good pairs in the Indian stock market.
Pair-trading helps to hedge sector and market-risk. For example, if the whole market crashes, and the two stocks plummet along with it, the trade should result in a gain on the short position and a negating loss on the long position, leaving the profit/loss close to zero in spite of the large move. Pairs trade is a mean-reverting strategy, betting that the prices will eventually revert to their historical trends.
Know your studs and mules
Other easy way to beat the market is to simply differentiate between stud and mule. It is difficult to know which way market is heading but definitely it is easy to know who are the star performers and who are the laggards. Under market neutral strategy, you simply buy studs and short sell mules.
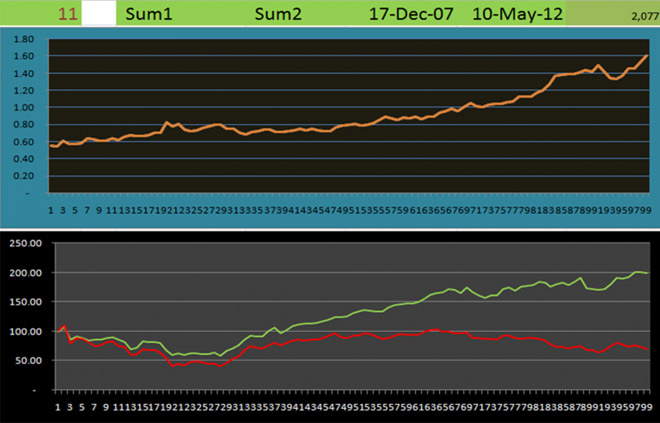
I differentiated 10 studs from mules over last four years and got following results.
Even if market has fallen over by 20% in last four years, our stud vs mule strategy has produced 150% return!
Chart 1 shows price co-relation line which perpetually is on its northward journey
Chart 2 shows my studs (green line) and mules (red line.) My studs are far ahead of mules.
STUD VS MULE
Mules: WIPRO CONCOR ZEE TATASTEEL IOC ICICIBANK NTPC SAIL UNIONBANK MRPL
My Studs:
ASIANPAINT ITC ACC COLGATE TITAN LUPIN SIEMENS TCS HDFC HEROMOTOR
Market Mules:
WIPRO CONCOR ZEE TATASTEEL IOC ICICIBANK NTPC SAIL UNIONBANK MRPL
We have studied 10 years of daily stock prices starting from the beginning of January 2001. The search for trading pairs is restricted to 40 financial stocks listed on the NSE. The results show that two co-integrated stocks can be combined in a certain linear combination so that the dynamics of the resulting portfolio are governed by a stationary process.
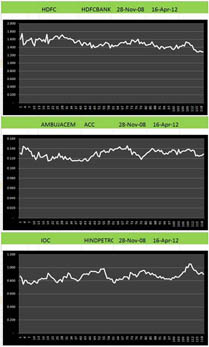
Examples of potentially correlated pairs:
SBI vs. HDFC Bank
ACC vs. Ambuja Cement
TCS vs. Infosys
Basket of heavy weights with Nifty
Basket of (HDFC Bank+SBI+PNB) vs. Bank Nifty
Banknifty vs. Nifty
Nifty vs. Sensex
Near-zero beta stocks
Seven year correlation analysis of SBI, HDFC Bank and PNB with Bank Nifty on a 1000 scale:
| Period | High | Low |
| 2004-Q2 | 960 | 890 |
| 2004-Q3 | 953 | 897 |
| 2004-Q4 | 927 | 880 |
| 2005-Q1 | 961 | 897 |
| 2005-Q2 | 933 | 892 |
| 2005-Q3 | 937 | 871 |
| 2005-Q4 | 945 | 900 |
| 2006-Q1 | 958 | 898 |
| 2006-Q2 | 997 | 930 |
| 2006-Q3 | 1,001 | 933 |
| 2006-Q4 | 974 | 928 |
| 2007-Q1 | 939 | 890 |
| 2007-Q2 | 964 | 901 |
| 2007-Q3 | 983 | 940 |
| 2007-Q4 | 995 | 933 |
| 2008-Q1 | 1,046 | 914 |
| 2008-Q2 | 1,039 | 956 |
| 2008-Q3 | 1,107 | 1,005 |
| 2008-Q4 | 1,187 | 1,082 |
| 2009-Q1 | 1,197 | 1,095 |
| 2009-Q2 | 1,186 | 1,053 |
| 2009-Q3 | 1,086 | 1,037 |
| 2009-Q4 | 1,106 | 1,050 |
| 2010-Q1 | 1,081 | 1,036 |
| 2010-Q2 | 1,130 | 1,049 |
| 2010-Q3 | 1,139 | 1,099 |
| 2010-Q4 | 1,118 | 1,067 |
| 2011-Q1 | 1,109 | 1,068 |
While fund managers agree that predicting theprice of individual stocks or the market is difficult, there is evidence suggesting that it may be possible to extrapolate the future correlation trend of a pair through their price spread series. A common way to attempt this is by constructing the portfolio such that the spread series is a stationary process. Sometimes it is difficult to establish price spread series of two stocks. There it may be suggested that one should create two baskets of stocks to analyze their spread. Regardless of how the portfolio is constructed, if the spread series is a stationary process, then it can be modeled, and subsequently forecasted, using techniques of time series analysis.
Sometimes it is possible to decipher a long-term equilibrium of outperformers and under-performers. A pair can be established by going long for an outperformer and short for an underperformer.
Market neutral strategy is not always a risk-free strategy. A quick decision needs to be made when the prices of the two securities begin to drift apart, i.e. the spread begins to trend instead of reverting back to the original mean. Dealing with such adverse situations requires strict risk management rules, which means the trader needs to exit an unprofitable trade as soon as the original setup - a bet for reversion to the mean - has been violated. This can be achieved by forecasting the spread and exiting at forecast error bounds. A common way to model, and forecast, the spread for risk management purposes is by using autoregressive moving average models.
The market neutral strategy holds both long and short positions with equal market risk exposures at all times. This is done by equating the weighted betas of both the long position and the short position within the portfolio. This approach eliminates net equity market exposure so that the returns realized should not be correlated with those of the market portfolio. This is equivalent to a zero-beta portfolio. Returns on these portfolios are generated by the isolation of alpha, which is a proxy for excess return to active management, adjusted for risk.
Why Long/Short Investing Strategies?
Investors who are able to overcome short-selling restrictions and have the flexibility to invest in both long and short positions can benefit from both winning and losing stocks. Traditional fund management does not allow investment managers to utilize short positions in their portfolio construction and so the investment decision-making process focuses on identifying undervalued stocks which can be expected to generate positive alpha. In effect, managers can only profit from those over-performing stocks, and specific information which suggests future under-performance is essentially worthless. This means that investors can only benefit from half the market.
However, derivatives segment of the stock market allows short-selling, hence investors can take advantage of short selling in building up a market neutral portfolio.
Why only bet on winners? Why avail yourself to only half the opportunity?
Profits can be earned from both winning and losing stocks simultaneously, earning the full performance spread. The fact that long / short equity strategies ensure a more efficient use of information than long-only strategies is the result of not restricting the weights of the undervalued assets to zero. By allowing portfolio returns to be borne by both the short set under-performing the market and the long set over-performing the market, the strategy generates double alpha. Another benefit of long/short investing is that, potentially, short positions provide greater opportunities than long positions. The search for undervalued stocks takes place in a crowded field because most traditional investors look only for undervalued stocks. Because of various short-selling impediments, relatively few investors search for overvalued stocks.
Furthermore, security analysts issue far more buy recommendations than sell recommendations. Buy recommendations have much more commission-generating power than sells, because all customers are potential buyers, but only those customers having current holdings are potential sellers, and short-sellers are few in number. Analysts may also be reluctant to express negative opinions. In a long-only portfolio, the investor is only able to under-weight over-valued or poor-quality stocks. Effectively, the investor cannot profit from this mispricing - they can only reduce losses. A long / shortstrategy allows the investor to explicitly profit from this type of mispricing.